
Background & results
Manufacturing runs from engineering design through machining to shipment across many stations — a long chain that demands live production visibility and utilisation management.
A digital gap sat between ERP and the floor: ERP held the work order with product, spec, quantity, due date and BOM, but once released, scheduling, progress and machine status depended on verbal reports and walking the floor.
Actual machining time, utilisation and load could not be compiled or analysed live, so scheduling and capacity decisions rested largely on experience.
Energy management went no further than after-the-fact plant totals from the monthly utility bill — nothing broke consumption down by operation, machine or work order.
The CNC area runs eight lathes under long, heavy duty cycles — the plant’s main energy and carbon hotspot — yet consumption and idle time per machine, per work order and per stage of machining were unknown.
Production and energy data were not joined up, so consumption and emissions could not be mapped to work orders or machines — limiting both efficiency decisions and continuous improvement.
SCOPE
Work-order dispatch, production reporting (AIoT pulls completed quantities; start, pause and end states), utilisation monitoring and work-order visibility
Machine-level consumption monitoring, energy visualisation (total and average use, growth rate, emissions) and work-order energy analysis
AIoT sensors and current transformers on eight CNC machines, aggregated through an AIoT Smart Box and routed to MES or EMS
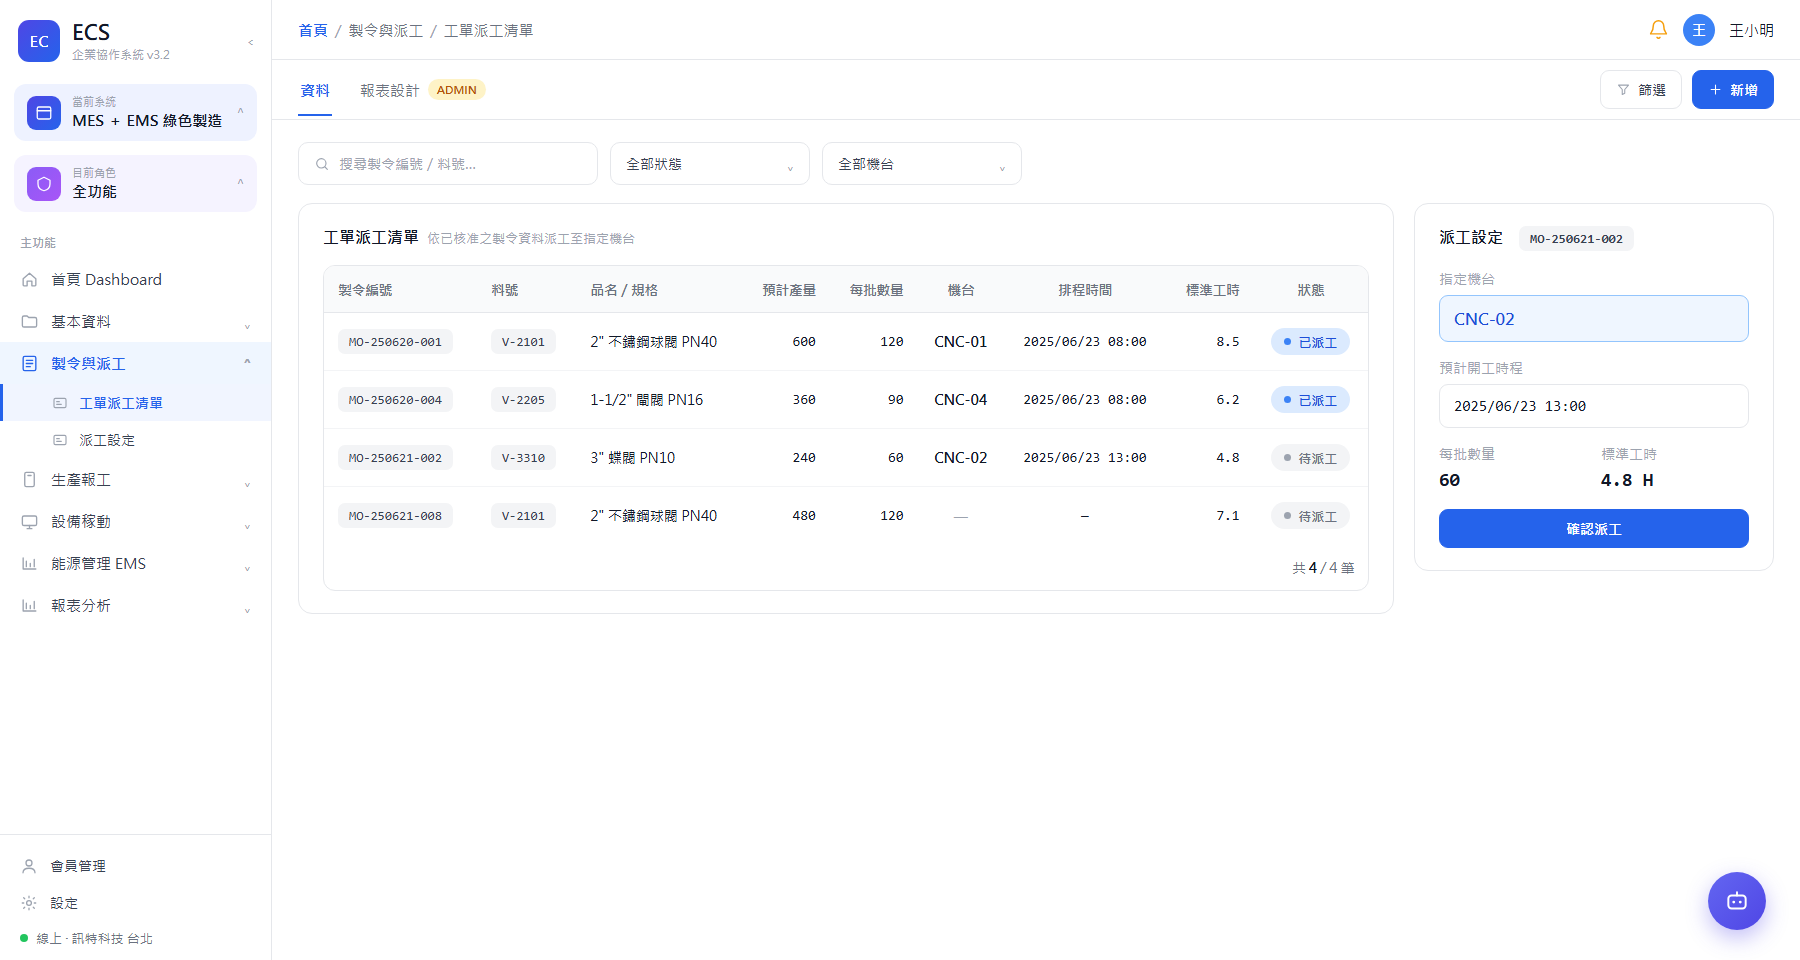
See which machine a released order went to, and when it starts
Approved work orders are dispatched to a nominated machine or station with a planned start time, and listed with order number, part number, planned quantity, batch size, standard hours and schedule.
Work-order management and dispatch list + dispatch setup
Let the machine report, not the operator’s notepad
AIoT pulls completed quantities straight from the machine, with start, pause and end states switching alongside — run time, downtime and completion are all logged, making the production history fully traceable.
Production reporting (start / pause / end) + live status by machine
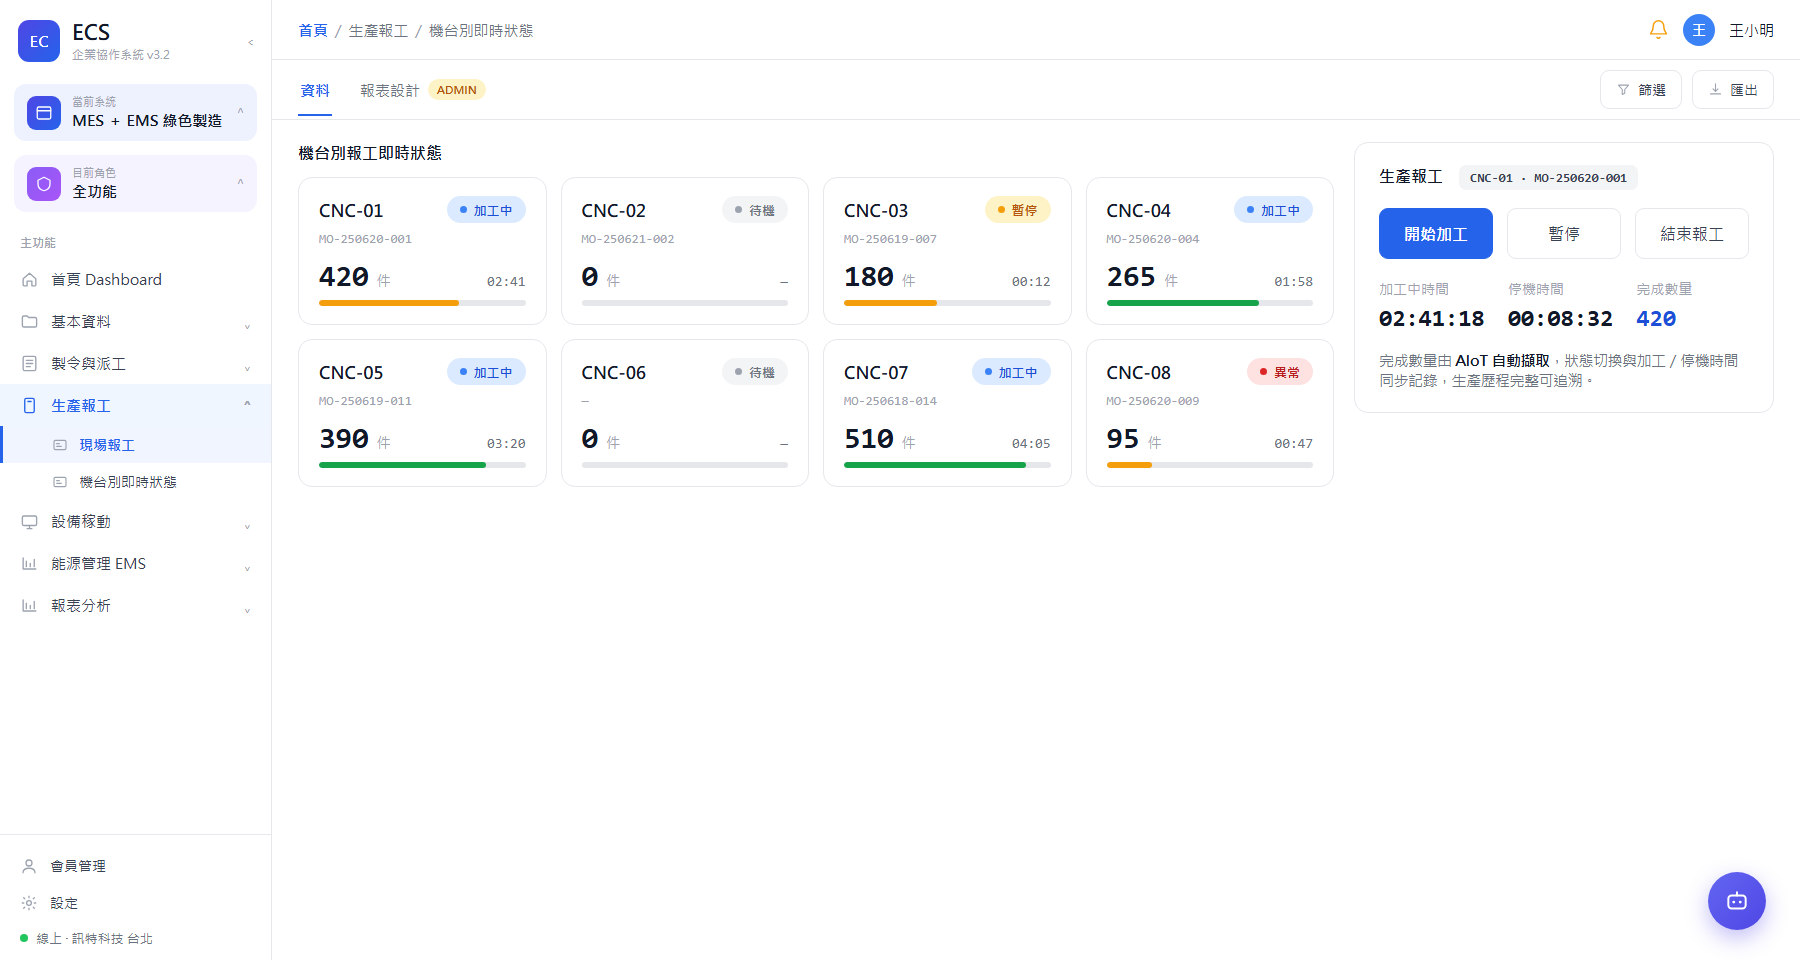
See at a glance which machines are running and which are waiting
Reporting and AIoT status feeds combine into a live graphical view of every machine — running, idle, paused or faulted — with utilisation, machining hours and downtime totalled alongside.
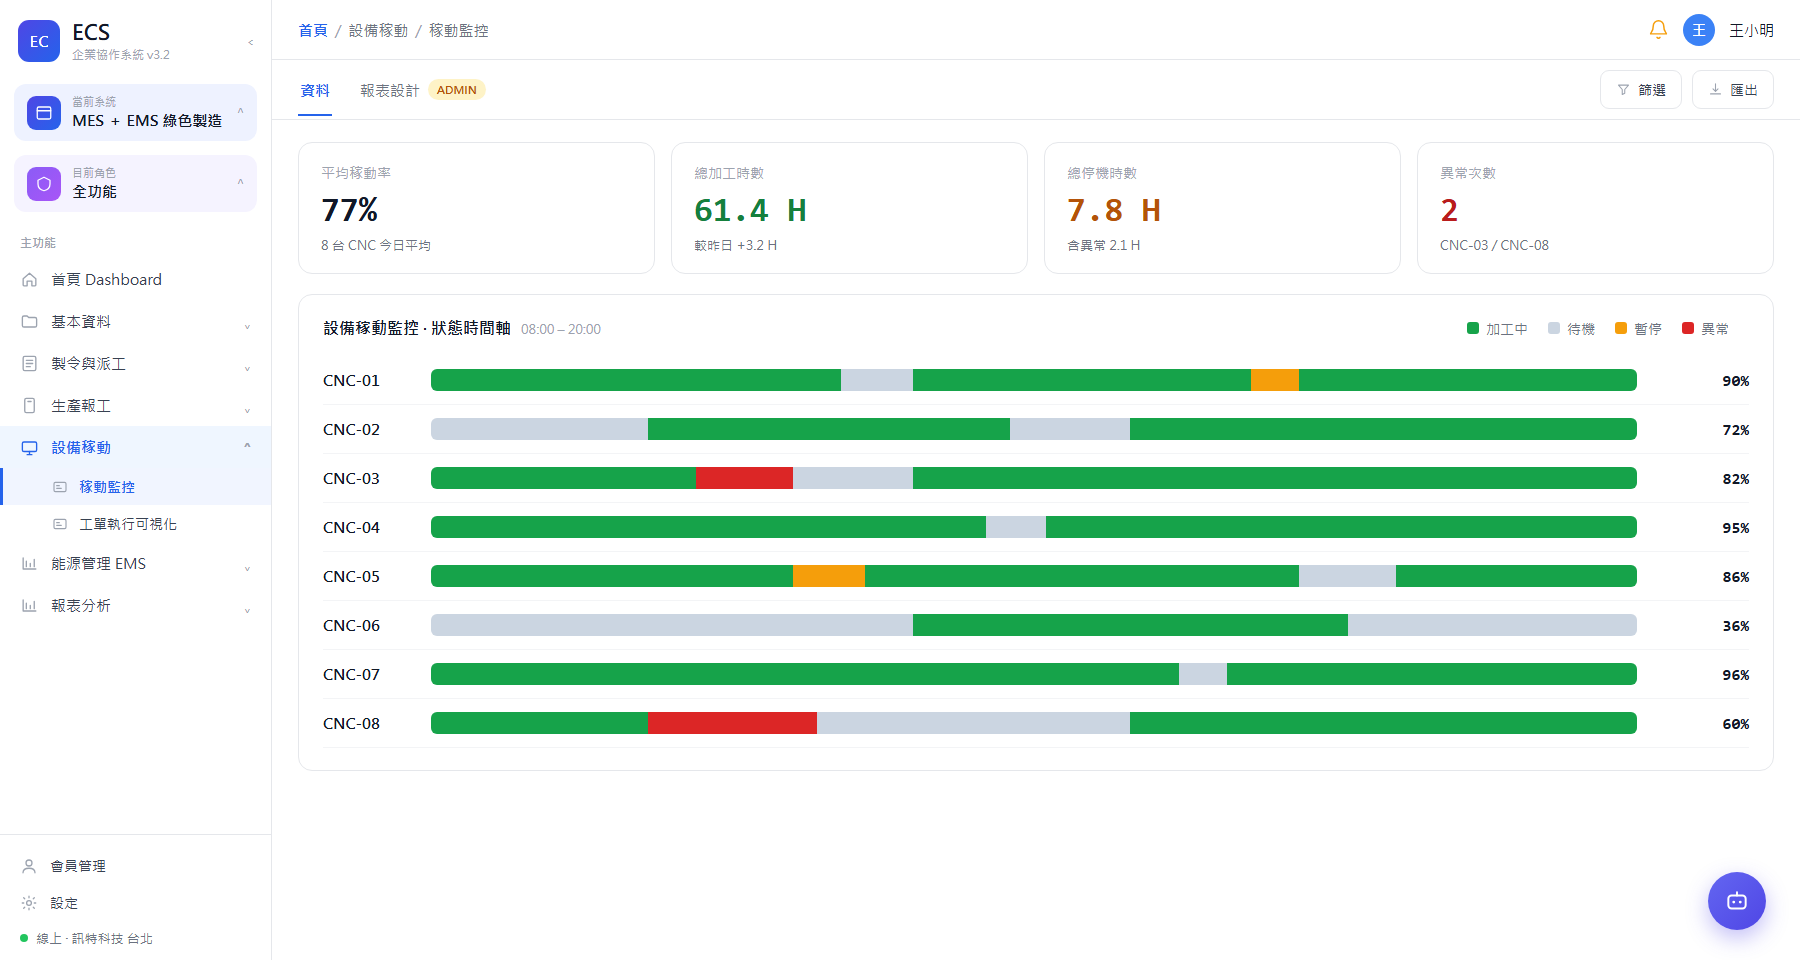
Utilisation monitoring (rate and status timeline) + live machine overview
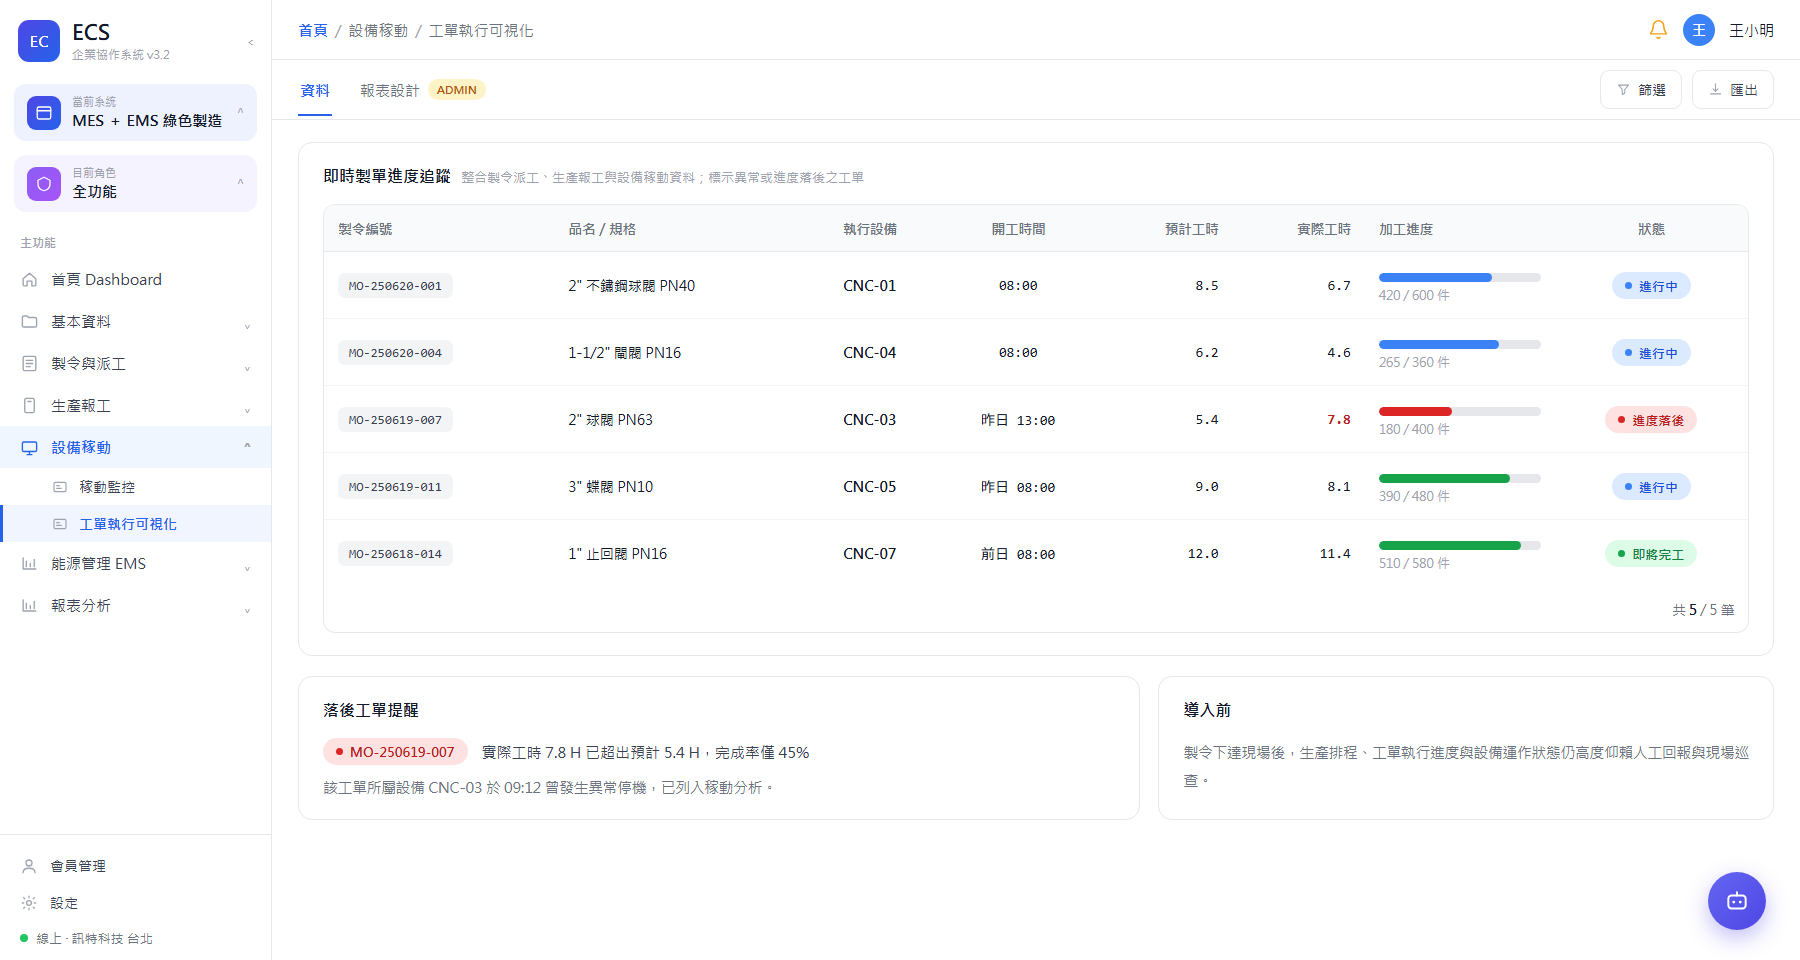
The system should flag the work orders falling behind
Dispatch, reporting and utilisation data come together on one screen showing each order’s start time, planned versus actual hours, progress, machine and completed quantity — with faulted or lagging orders flagged.
Live work-order progress tracking
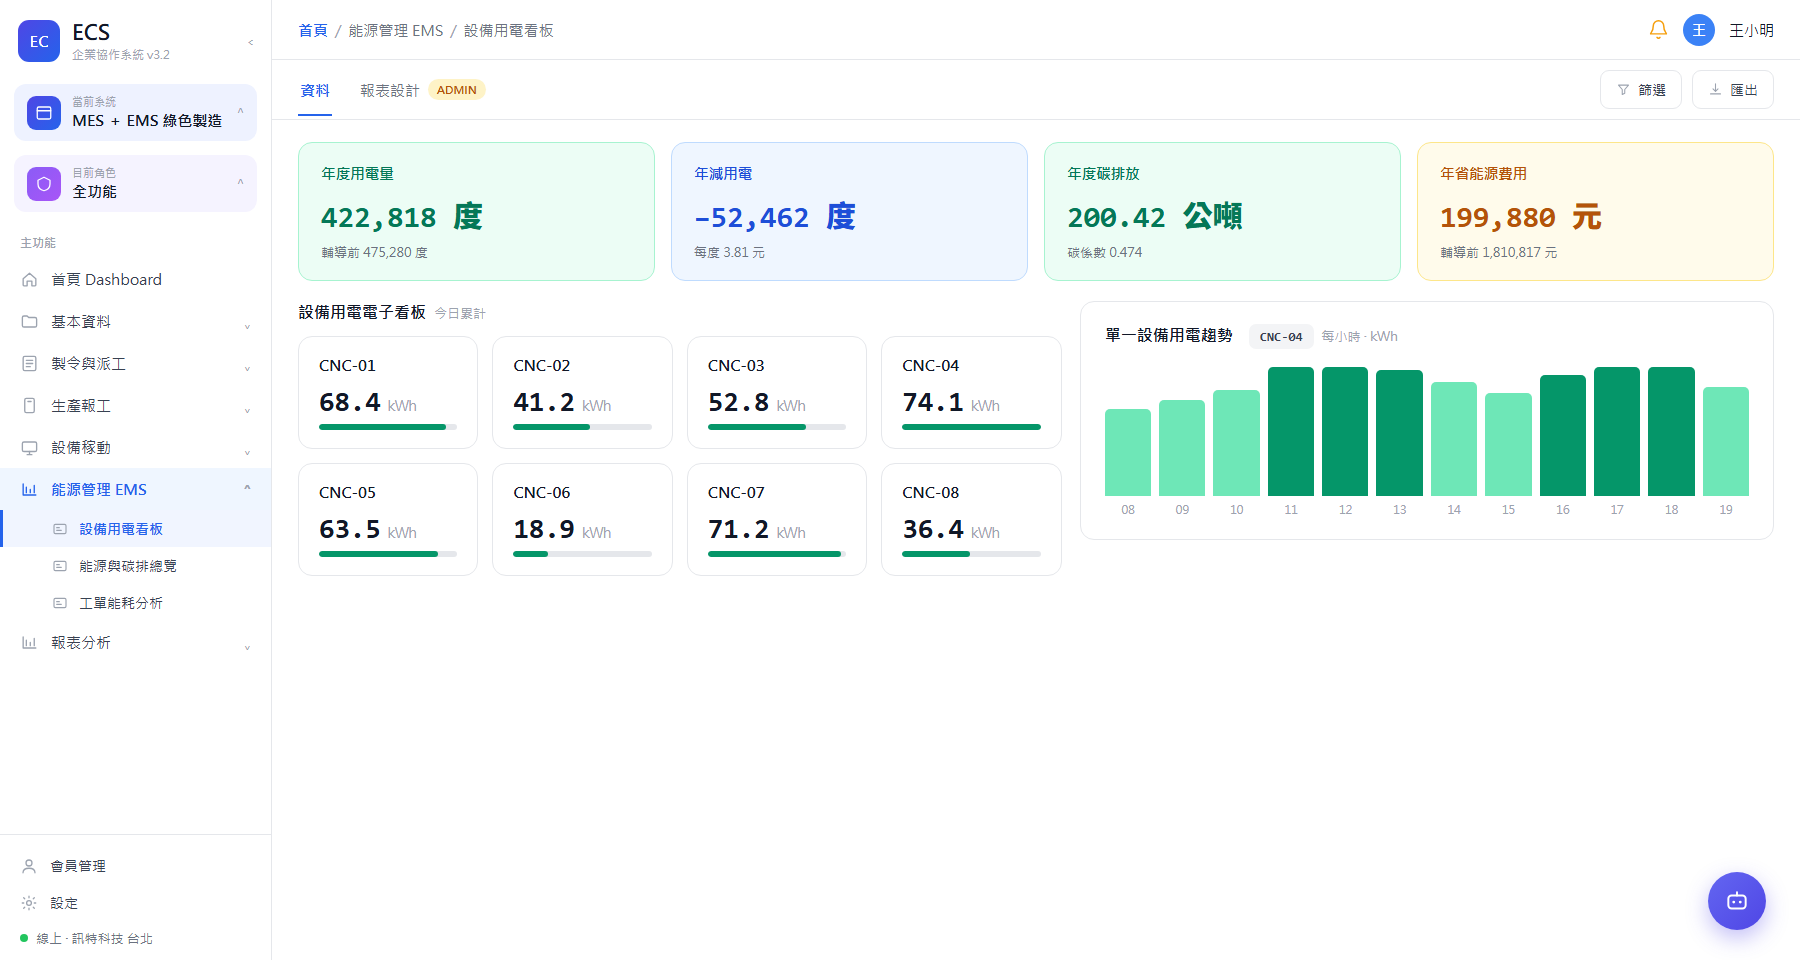
Break consumption down per machine, not one bill for the plant
EMS collects consumption live from each machine and reports usage, trend and ranking by equipment type, machine or period, alongside total and average consumption, growth rate and emissions.
EMS consumption board + per-machine trend + energy and carbon overview
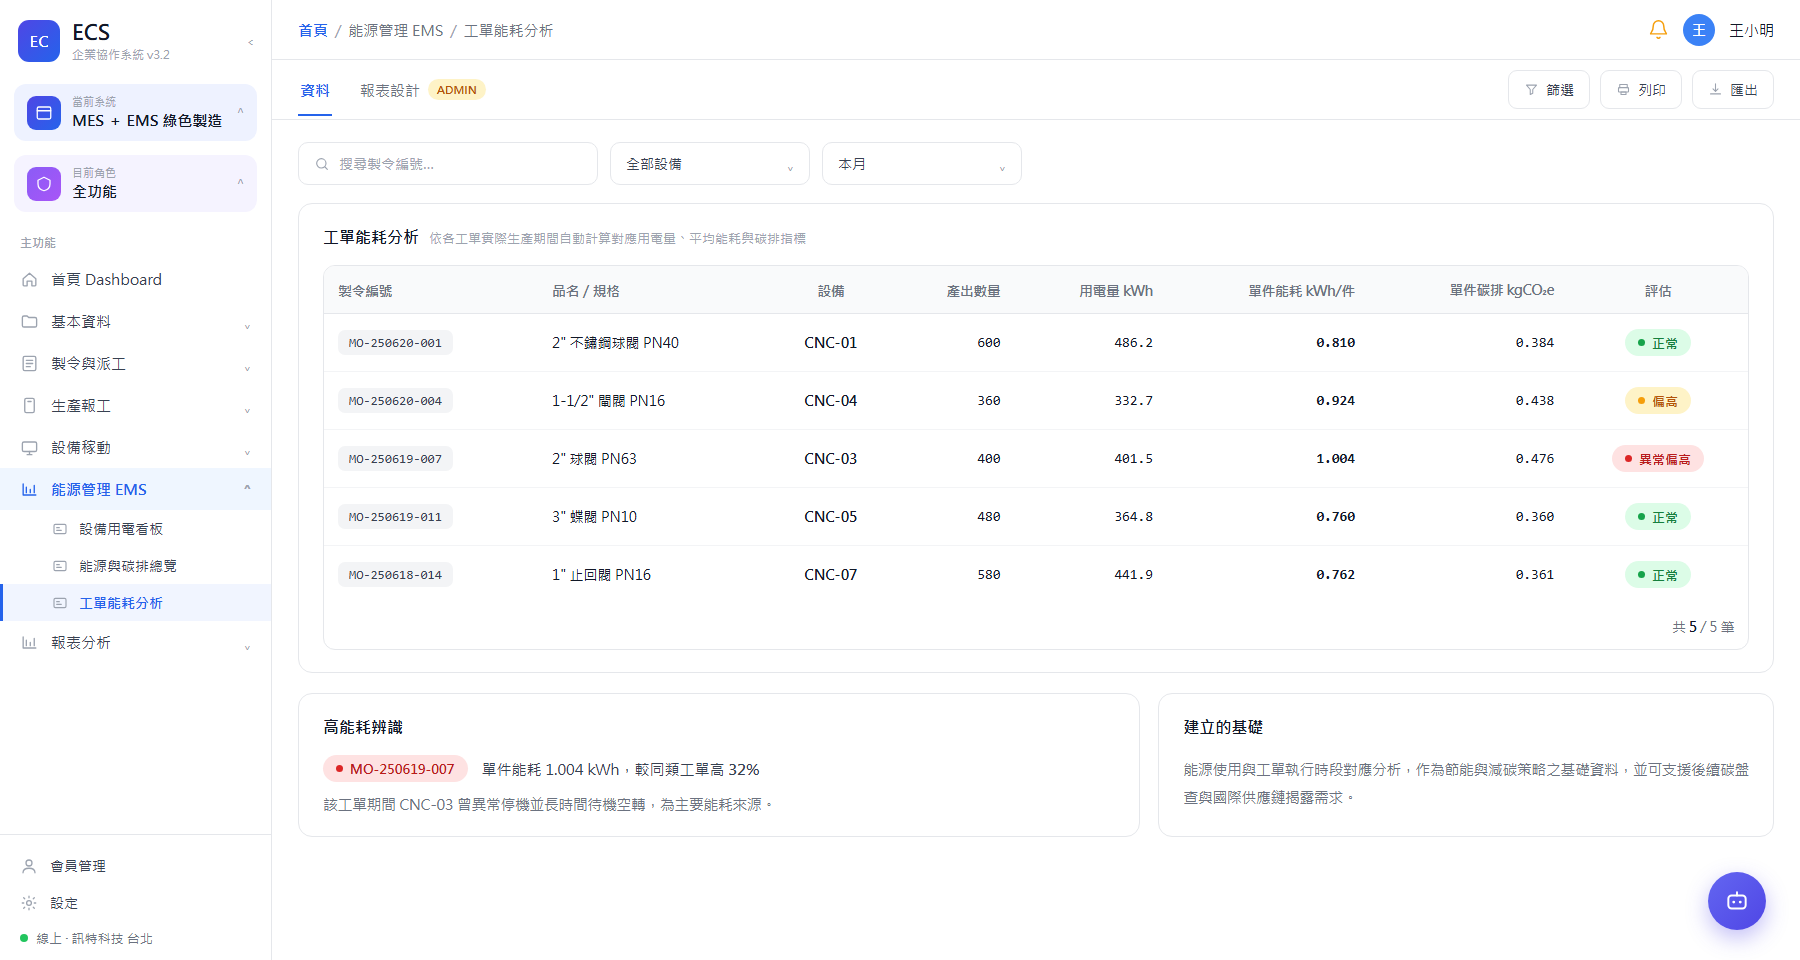
How much power — and carbon — did this work order actually cost
EMS and MES data combine to calculate consumption, average energy use and related indicators automatically for each order’s actual production window — building energy and carbon data at work-order level.
Work-order energy analysis (consumption and carbon per order)
RESULTS
- Reporting and utilisation are logged systematically, turning production information from something compiled afterwards into something visible now — replacing verbal reports and floor walks.
- Order start and end times, machine usage and output are recorded as a traceable execution history — the basis for capacity assessment, scheduling and process optimisation.
- Run and idle states are presented systematically, exposing utilisation bottlenecks and allowing people and machines to be allocated sensibly.
- Energy moves from a single bill to machine-level visibility, establishing the habit of managing what can actually be seen.
- Linking consumption to work-order execution windows gives energy-saving and decarbonisation strategy a factual base.
- Production and energy management become codified processes rather than individual know-how, strengthening long-term operational resilience.